

 Facebook
 X
X
 Pinterest
 Copy Link
What these trends mean for the public:
If you are thinking about buying a home in 2023, it is important to be prepared for a competitive market. You should also be aware that mortgage rates are rising, so you may need to factor that into your budget. If you are thinking about selling your home in 2023, you are likely to be in a good position. Home prices are still high and there is a lot of demand from buyers. However, you should still be prepared to negotiate on price and terms.
Overall, the real estate market in 2023 is expected to be challenging for both buyers and renters. However, there are still opportunities for people to achieve their real estate goals.
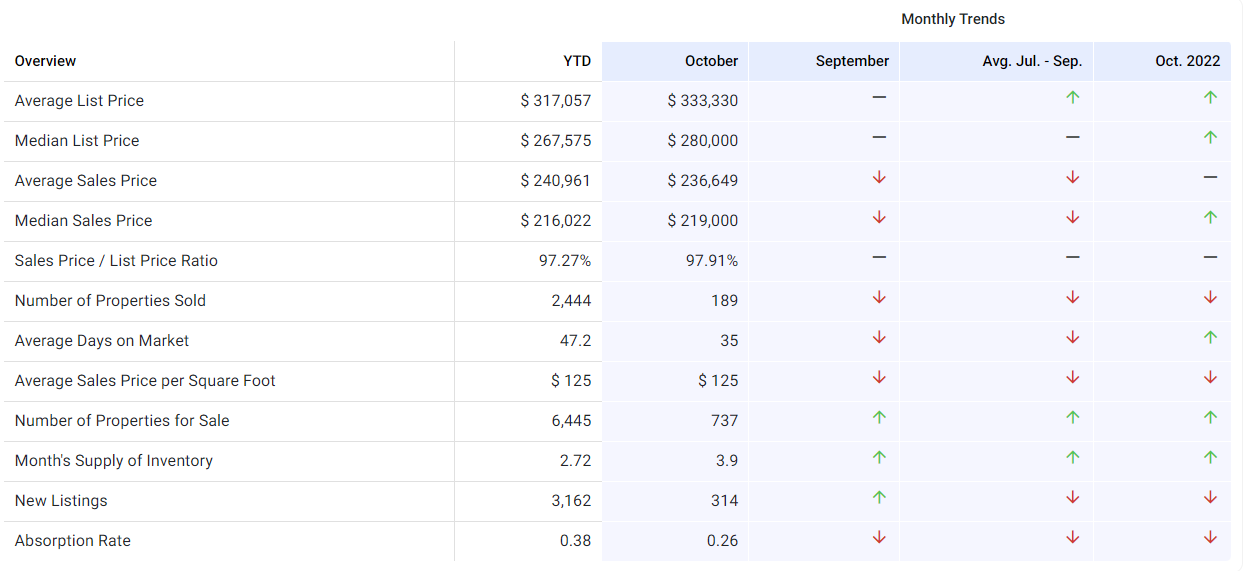
The overview below shows real estate activity from January 2023 to October 2023. You will see data comparisons between October and the previous month, the last three months and October 2022.
Average & Median Sales Price
Let’s crunch the numbers, shall we? In October 2023, the median sales price was $219,000, slipping 3% from the previous month’s $225,773, yet still up 9.5% from October 2022’s $200,000. This marked the highest median sales price we’ve seen in October since 2021! Meanwhile, the average sales price in October 2023 was $236,649, dipping 4.89% from September 2023’s $248,815, but matching October 2022’s average. So, while we’re at a mid-level compared to 2021 and 2022, things are still looking up!

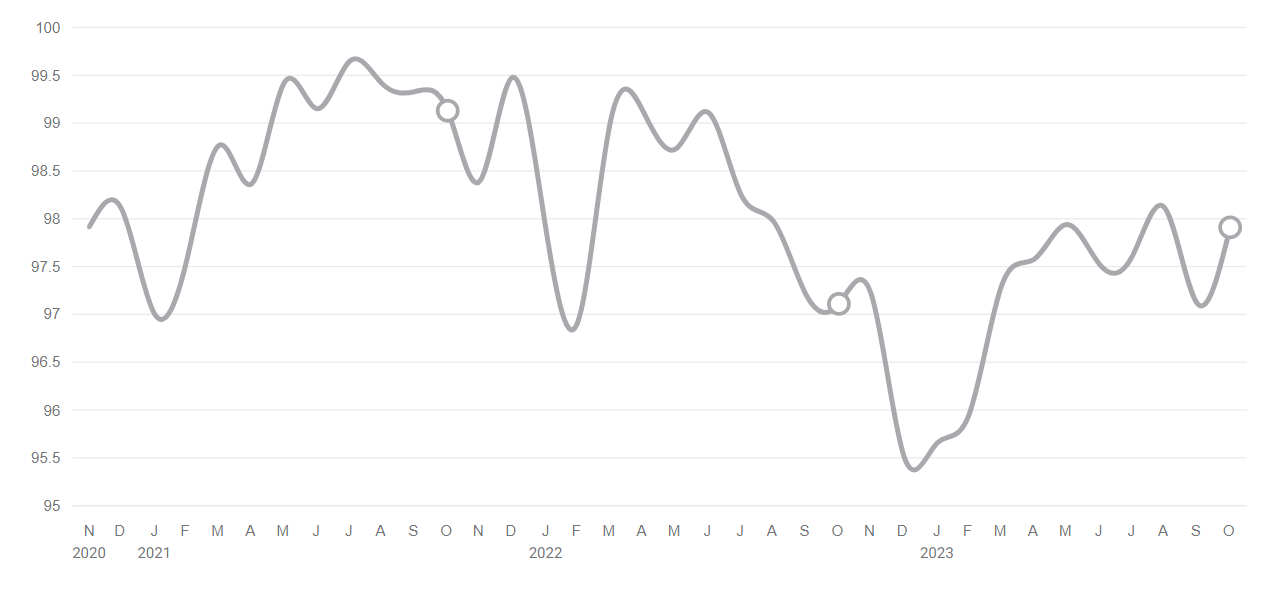
Sales Price / List Price Ratio
The sales price to list price ratio is calculated by dividing the average sale price by the average list price of the sold properties, stated as a percentage. If the percentage is over 100, it indicates that the homes sold for more than the list price. Conversely, if it is under 100, it implies that the homes sold for less than the list price. In October 2023, the sales price to list price ratio remained constant at 97.91%, which is equivalent to the previous month and October 2022.
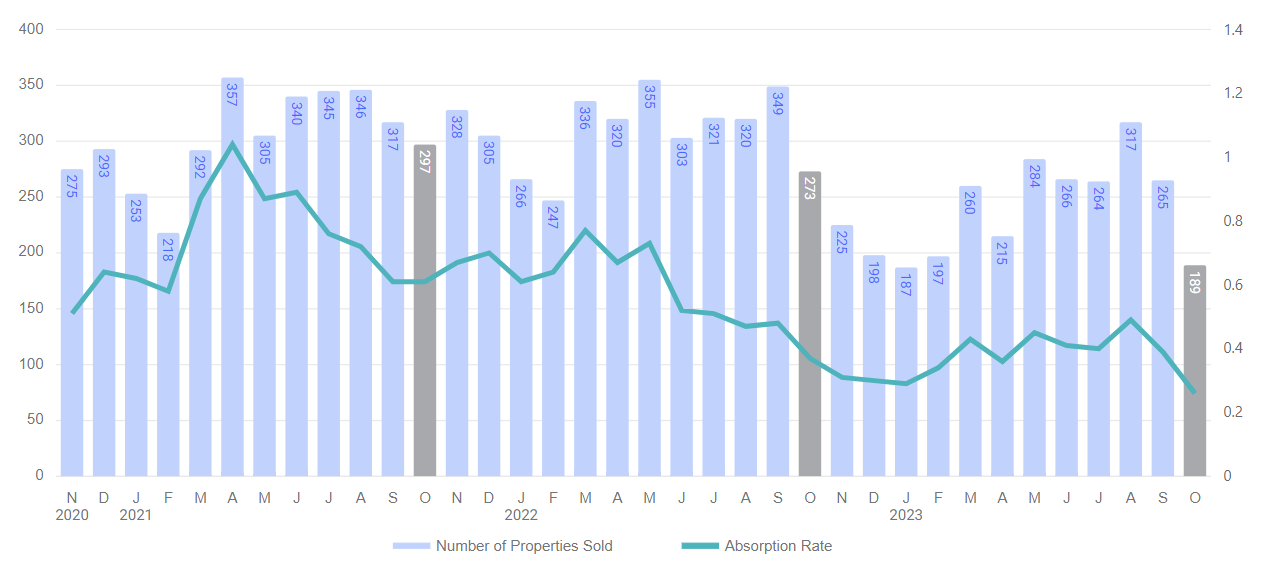
Number of Properties Sold & Absorption Rate
In October 2023, a total of 189 properties were sold, a sharp decrease of -28.68% from the previous month’s 265 and a staggering -30.77% from the sales in October 2022 which were 273. This month’s sales have hit a record low compared to the sales in October 2022 and 2021. To calculate the absorption rate, divide the average number of sales per month by the total number of available properties.
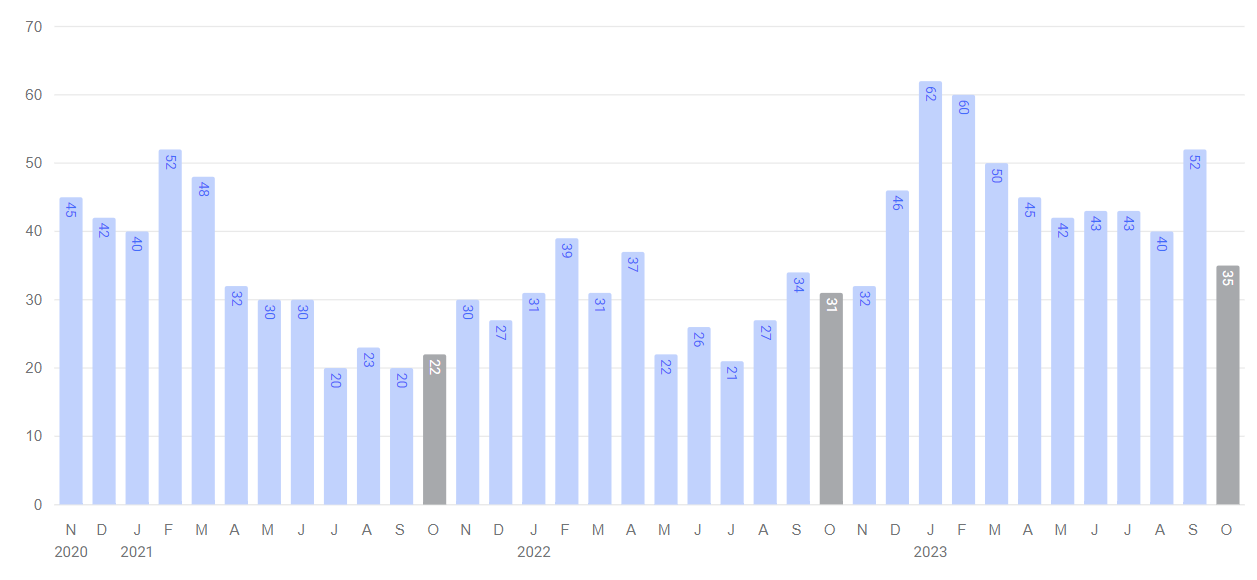
Average Days on Market
The average days on market (DOM) metric signifies the number of days a property is listed before it is sold. Typically, a DOM trend moving upwards indicates a shift towards a buyer’s market, while a downward trend indicates a move towards a seller’s market. In October 2023, the DOM was 35 days, representing a -32.69% decline from the previous month’s 52 days and a 12.90% increase from October 2022’s 31 days. The October 2023 DOM was the highest when compared to October 2022 and 2021.
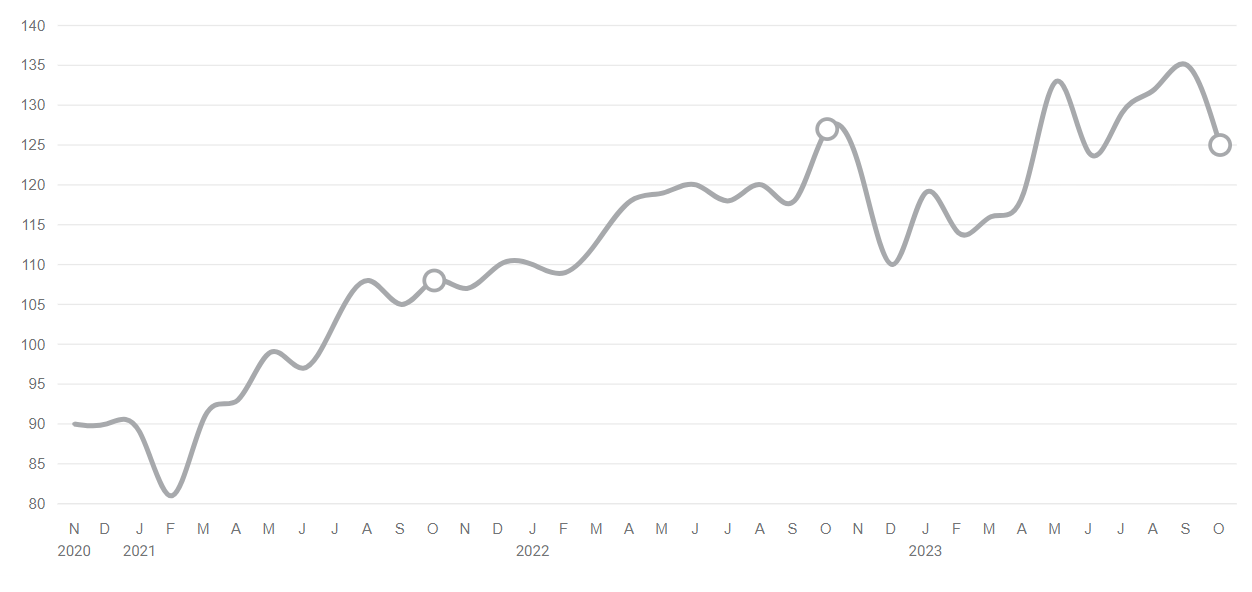
Average Sales Price per Square Foot
The sales price per square foot is a reliable metric to determine the trajectory of property value. In October 2023, the average sales price per square foot was $125, representing a decrease of -7.41% from the previous month’s $135 and a -1.57% decline from October 2022’s $127.
Inventory & MSI
In October 2023, a whopping 737 properties were up for grabs, a 7.12% leap from the previous month’s 688 and a 1.10% rise from October 2022’s 729. The inventory was at an all-time high compared to the past two years. As for the Market Supply Index (MSI), a lower score is a seller’s dream come true, while a higher one is what buyers cheer for. In October 2023, the MSI was 3.9 months, the highest score compared to October 2022 and 2021

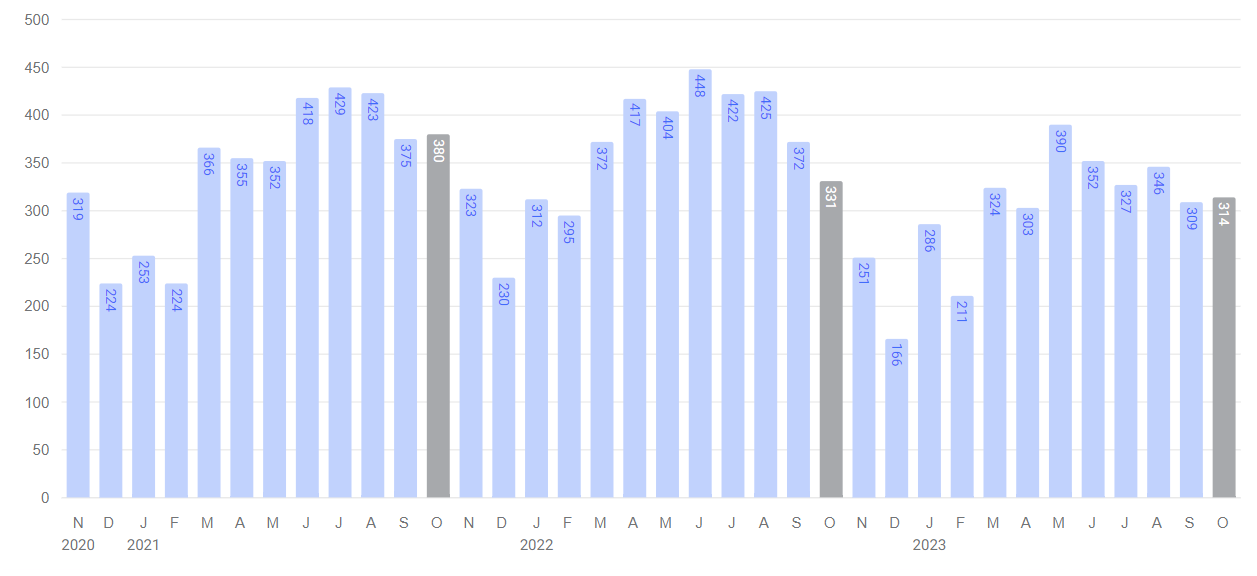
New Listings
In October 2023, there were 314 new listings, indicating a 1.62% increase from the previous month’s 309. However, this figure was 5.14% lower than the 331 recorded in October 2022. It’s worth noting that October 2023 marked the lowest number of listings compared to October 2022 and 2021.
Based on information from Central West Tennessee Association of REALTORS for the period 11/01/YYYY through 10/01/2023. Source data is deemed reliable but not guaranteed.
